Dependency map
A single view of the site and everything it relies on, with each dependency positioned against the hazards that can reach it.
Why standard flood layers often fail to reveal operational consequences for facilities and supply chains.
01
The situation
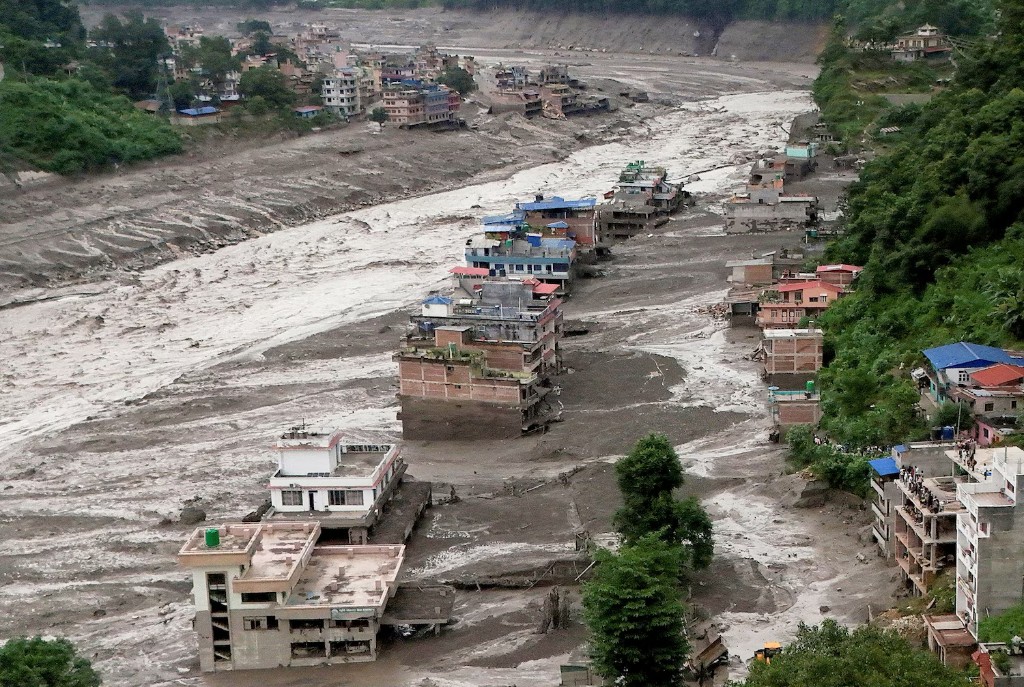
After sustained rainfall, a debris flow moved through the valley floor below a production site. The buildings were untouched — the site had been located deliberately above the modelled flood extent, and the hazard map confirmed it.
Production stopped anyway. The single access road was cut, the medium-voltage substation feeding the site was submerged, and the two nearest logistics operators were both on the valley floor. The facility was intact and unreachable at the same time.
At a glance
02 — The question
Is this site still viable, or is it one storm away from the next shutdown?
The board had to decide whether to invest further in the location or begin planning an alternative. The available flood mapping could not answer that, because it described where water goes — not what stops working when it gets there.
03
What we did
Three stages, run over six weeks, combining desk analysis with survey work in the valley itself.
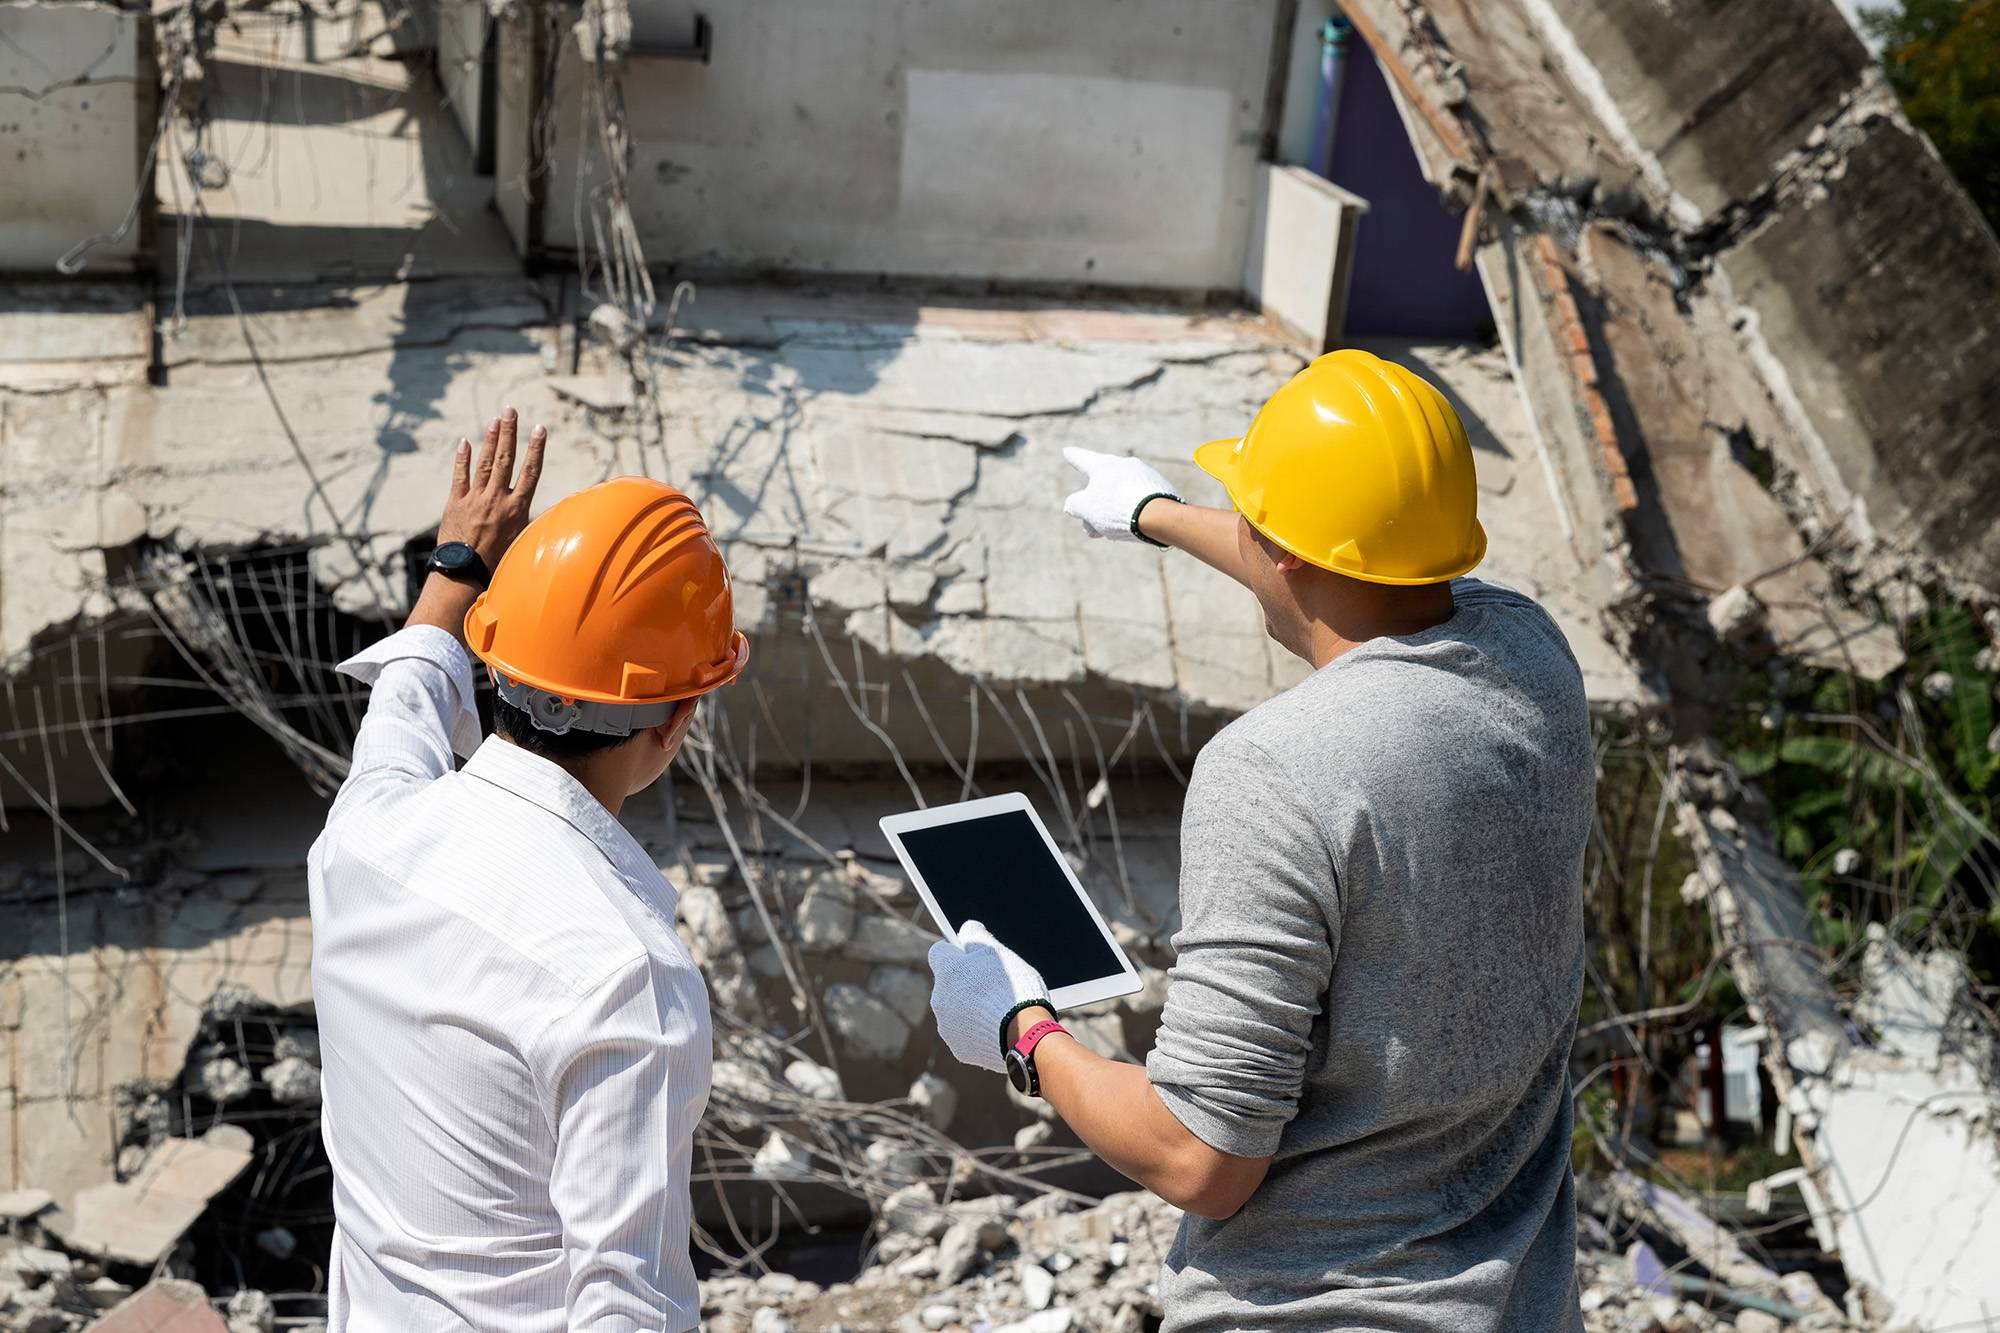
We mapped every element the operation needs in order to run — access routes, power and water supply, telecoms, upstream suppliers and outbound logistics — and placed each one geographically.
Each dependency was tested against the hazards present in the valley — river flooding, debris flow and slope instability — at several intensities rather than a single design event.
For each scenario we established what fails, in what order, how long restoration realistically takes, and which failures the company can absorb versus which ones stop production outright.
04
What was delivered
Three documents the board could act on in a single sitting.
A single view of the site and everything it relies on, with each dependency positioned against the hazards that can reach it.
Four disruption scenarios with the resulting failure sequence and expected production loss for each, making the cost of inaction explicit.
Interventions ranked by how much exposure each removes — separating what to fix now, what to plan for, and what only relocation would solve.
0
Dependencies mapped
0
Disruption scenarios modelled
0wks
Longest modelled shutdown
We had been assessing the wrong thing for years. The site was never the risk — the valley was.Operations director, manufacturing client
Facing a similar situation?